Advent Day 22: Bridging field data and remote sensing
Dec 22, 2025
Yesterday’s post focused on the challenge of moving from patterns in remote sensing data to ecological processes. And I tend to get ahead of myself, so today’s post steps back to the data themselves to ask how field measurements and remote sensing observations get meaningfully connected in the first place. Before pixels can inform processes, they must first be carefully and explicitly linked to data collected on the ground.
Remote sensing does not replace field data, its greatest strength is how tightly it can be integrated with those data. Field data are precise, local, and biologically explicit. Remote sensing data are spatially extensive, repeatable, and aggregated. Each captures a different view of the same system, and in many instances they are better together. Field data also play different roles in remote sensing studies. Field measurements may be used to calibrate models, evaluate predictions, interpret remote sensing patterns, or test ecological hypotheses. These different roles have different requirements. Calibration requires coverage of the full range of conditions, evaluation requires independence, interpretation requires process knowledge, hypothesis testing requires careful experimental or observational design. Treating a single dataset as suitable for all purposes can weaken inference, even with high quality data.
When linking remote sensing and field data, we need to understand and address three practical challenges:
- Scale harmonization: a plot samples a small, specific area, while a pixel integrates everything within its footprint. Decisions about buffering plots, aggregating measurements, or matching observation dates shape results from the start. Even small mismatches in spatial resolution or timing can bias models and interpretations. The goal is to answer whether field measurements actually match what a pixel observes
- Representativeness: field data are often clustered in accessible or uniform areas, yet models are applied across heterogeneous landscapes. The critical issue is not sample size, but whether field measurements span gradients in structure, disturbance, and environment represented by the pixels or points in the remote sensing data. Here the goal is to assess whether field sites capture the range of conditions present in the remote sensing data.
- Measurement compatibility: remote sensing sensors measure reflectance and structure, not biomass, cover or growth directly. Translating between them requires assumptions that may change across ecosystems, seasons or states. Making these assumptions explicit clarifies what a remote sensing derived product can (and cannot) be interpreted to represent. The goal is to assess what assumptions link field variables to remote sensing metrics.
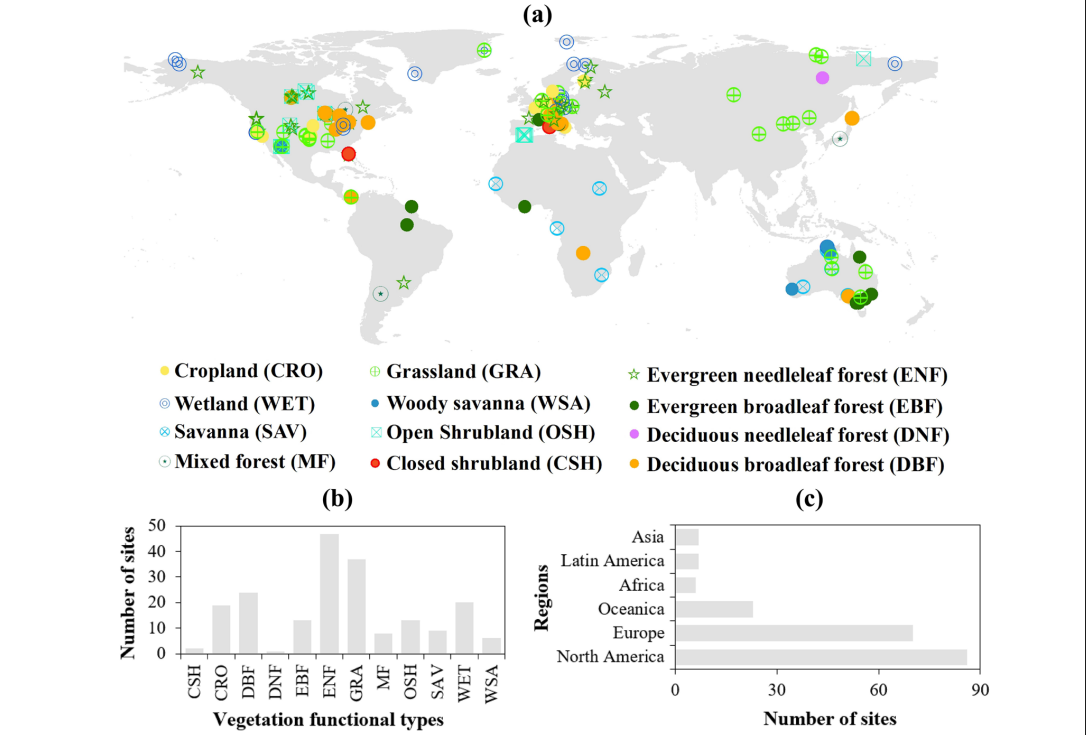
A nice example of the representativeness challenge comes from global eddy-covariance networks such as FLUXNET. Towers may be treated as ground truth for validating remote sensing products, but their spatial distribution is highly uneven as this figure from Fang et al 2024 shows. Ground truth is only meaningful when we know what area and environmental conditions this truth actually represents.
Remote sensing is best used when connections are explicit. This happens through clear documentation and justification of how plots relate to pixels, why particular field variables were chosen, what assumptions link field to remote sensing data and where or when those assumptions are likely to break down. Ecologists benefit from asking how field and remote sensing measurements are being connected, what ecological variation is constrained by those links, and what uncertainty remains unresolved. In other words, bridging field data and remote sensing is not about making the two datasets match perfectly. It is about clearly explaining how the two are connected, what choices were made along the way, and what those choices mean for interpretation. Writing these decisions down (ideally through open workflows, metadata, and reproducible code) also makes processing and analyses more transparent, testable and reusable.
–
References
Fang, J., Fang, J., Chen, B., Zhang, H., Dilawar, A., Guo, M., & Liu, S. (2024). Assessing Spatial Representativeness of Global Flux Tower Eddy-Covariance Measurements Using Data from FLUXNET2015. Scientific Data, 11(1), Article 569. https://doi.org/10.1038/s41597-024-03291-3