Advent Day 19: Uncertainty in maps
Dec 19, 2025
Remote sensing data and derived products often look authoritative. They have clean boundaries, sharp colours, and clearly defined categories. After discussing scale mismatch yesterday, today’s post focuses on a related but distinct issue: uncertainty. Even when scale is appropriately aligned with an ecological question, a map remains a model rather than a direct observation of reality. Model uncertainty is not a flaw to be eliminated, but an inherent property of remote sensing products that must be acknowledged, interpreted, and ideally quantified.
Uncertainty enters at every stage of the remote sensing workflow. Sensors impose noise and physical limits, viewing geometry and atmospheric conditions alter recorded signals, and the properties of the observed surfaces influence how reliably ecological features can be detected. Models then translate spectral data into ecological variables forcibly using assumptions and incomplete training data. As a result, maps reflect not only ecological patterns, but also data structure, algorithms, and analytical choices. In this context, uncertainty describes confidence in an estimate, while accuracy describes agreement with reference data. These concepts are related but not interchangeable, and a map can be statistically accurate while still missing ecologically meaningful variability.
Because of this, commonly reported accuracy metrics can give a false sense of confidence. Overall accuracy, kappa, or RMSE summarize model performance across an entire dataset, but rarely reveal where or why predictions fail. A map can achieve high accuracy by correctly classifying widespread, dominant conditions while systematically misrepresenting rare LULCs, edges, or ecologically important extremes. From an ecological perspective, these errors may be the most informative locations, as they coincide with transition zones, stress gradients, or emerging change. Interpreting remote sensing products therefore requires moving beyond global accuracy toward spatially explicit uncertainty metrics which ask where a model is reliable, where it extrapolates, and where interpretation should be done cautiously (if at all).
Rather than listing sources of uncertainty, it is much more useful to ask how uncertainty manifests and to communicate it. Common approaches include:
- Probability or confidence surfaces show how certainty varies spatially rather than presenting a single best estimate
- Ensemble or multi-model approaches capture sensitivity to model structure, assumptions, or training data
- Area of applicability (AOA) or extrapolation diagnostics identify where predictions extend beyond the space represented in the training data
- Temporal uncertainty metrics highlight instability driven by seasonality, data gaps, or sensor changes
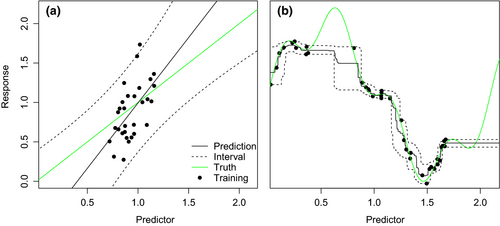
This figure from Meyer & Pebesma 2021, from their paper describing how to delineate AOAs and measure uncertainty in predictions using a dissimilarity index, shows how predicting beyond the training data becomes unreliable for linear regression (left: a) and random forest (right: b) models.
Treating maps as definitive answers can lead to overconfident inference, particularly when uncertainty is structured or ecologically meaningful. Ecologists working with remote sensing data who assess uncertainty are better equipped to distinguish robust signals from artifacts, identify where predictions are reliable, and recognize where additional data or alternative approaches are needed. This distinction becomes especially important when maps are used to inform conservation priorities, land-use planning, or management decisions, where apparent precision can mask substantial local risk. Don’t let uncertainty scare you; it is not a limitation of remote sensing but a potential source of information about ecological complexity, data constraints, and the boundaries of inference.
–
References
Meyer, H., & Pebesma, E. (2021). Predicting into unknown space? Estimating the area of applicability of spatial prediction models. Methods in Ecology and Evolution /, 12(9), 1620–1633. https://doi.org/10.1111/2041-210X.13650