Advent Day 18: When scale doesn’t match
Dec 18, 2025
Yesterday’s post focused on how remote sensing observes ecosystems across multiple spatial, temporal, spectral, and thematic scales. Today’s post is about what happens when those scales don’t line up with the ecological process or question of interest. Scale mismatch is one of the most common (though less commonly acknowledged) sources of misinterpretation in ecological remote sensing.
Remote sensing allows ecologists to examine patterns across unprecedented spatial extents, but not all ecological processes are visible at all resolutions because they operate at specific scales. Data that capture broad trends can obscure local-scale heterogeneity, while high resolution observations may miss broader context or longer term dynamics. Problems arise when inferences are drawn without considering whether the scale of observation, such as pixel size in this instance, aligns with the scale at which the ecological process actually occurs.
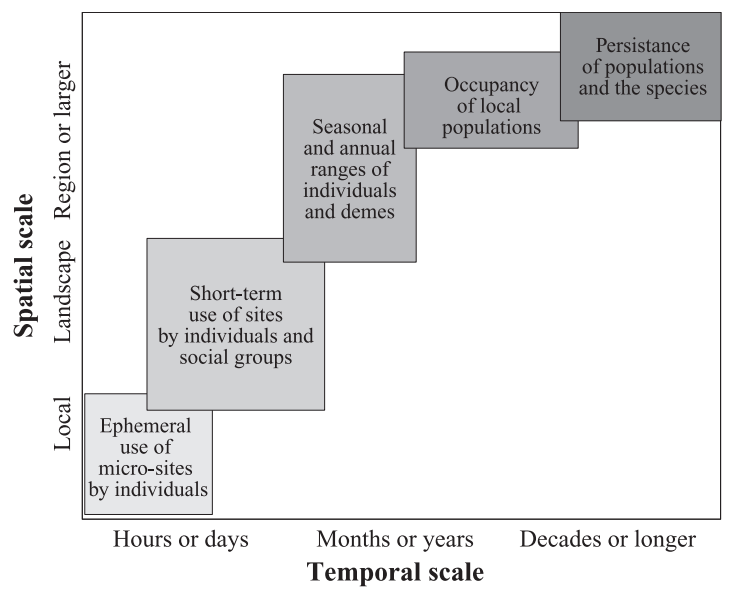
Scale mismatch is a challenge in species–habitat studies because many organisms select habitat hierarchically, across nested spatial scales. A bird migrating to its breeding grounds may first select forested landscapes, then mature stands, and finally individual trees with specific features like existing cavities as a nest site for secondary cavity nesters. As shown in the figure from Mayor et al 2009, different spatial and temporal scales are relevant for different uses for individuals, groups and populations. Yet habitat analyses often rely on coarse LULC classes that capture only the broadest level of this hierarchy. This mismatch rarely reflects a lack of ecological understanding. Instead, it often arises because fine-scale structural data are unavailable, expensive to collect, or difficult to integrate across large areas. As a result, models can perform well statistically while obscuring the mechanisms that actually govern habitat selection on the ground.
Common manifestations of scale mismatch include:
- Coarse pixels used to explain fine-scale behavior or habitat selection
- Short time series used to infer long-term ecological change
- Static maps used to represent dynamic processes
- Regional averages masking local extremes or rare conditions
Scale mismatch can produce false negatives, misleading correlations, or apparently contradictory results across studies. Thoughtful interpretation requires asking not just what a model or map shows, but what the data is capable of observing. This is especially important at the intersection of two paradigms: a data-driven approach common in remote sensing, where patterns emerge from large datasets, and an ecology-driven approach, where hypotheses are grounded in ecological processes and mechanisms. Explicitly matching, or intentionally bridging, scales helps connect these perspectives, while reducing overconfidence in results. Remote sensing is most powerful when scale is treated as a central ecological choice, not a technical afterthought.
–
References
Mayor, S. J., Schneider, D. C., Schaefer, J. A., & Mahoney, S. P. (2009). Habitat Selection at Multiple Scales. Écoscience (Sainte-Foy), 16(2), 238–247. https://doi.org/10.2980/16-2-3238