Advent Day 7: Topography as an ecological driver
Dec 7, 2025
Topography is the physical backbone of ecosystems. Digital elevation models (DEMs) underpin many ecological analyses because they capture the physical template that shapes microclimate, hydrology, and habitat distribution. Even small differences in terrain can determine where moisture pools, where frost lingers, how vegetation grows, and how species move.
DEMs can be derived from multiple data sources, each with its strengths:
- Airborne lidar (also called airborne laser scanning) provides some of the highest-resolution elevation data available, often down to sub-meter detail
- Photogrammetry reconstructs 3D surfaces from overlapping images, though dense vegetation can obscure the ground
- Radar is able to penetrate clouds and can map terrain in challenging conditions
- Old school on-the-ground surveying still matters too! Especially for calibration, validation, small-scale ecological studies, highly dynamic areas and under dense vegetation cover.
DEMs provide information on elevation, and they’re the starting point for a whole suite of terrain variables. Primary terrain variables, like elevation, slope, aspect and hillshade, come directly from elevation values, with no additional modeling. Secondary terrain metrics, like curvature, roughness, and water related indices, are derived by analyzing how elevation changes across space.
One important use of DEMs is watershed analysis. By modeling how water flows across the terrain reveals where it drains, where it accumulates, and where it converges. We can delineate catchments, identify stream networks, and estimate runoff pathways. Topographic and hydrological patterns are tied to ecological processes, and connecting watershed structure to ecology can uncover patterns that aren’t visible from spectral remote sensing data.
There are a lot of ecological applications of terrain-driven hydrology and topography:
- Locate microrefugia and drought-resistant sites: small depressions and subtle flow paths create cooler, moister microsites
- Map wetlands and riparian habitats: drainage networks indicate where water and nutrients accumulate
- Explain species distributions: slope, aspect, and topographic position shape microclimates
- Identify susceptible areas: steep slopes and flow convergence highlight unstable terrain prone to landslides or erosion
- Interpret vegetation patterns and forest structure — topography combined with spectral or lidar data reveals productivity and canopy dynamics
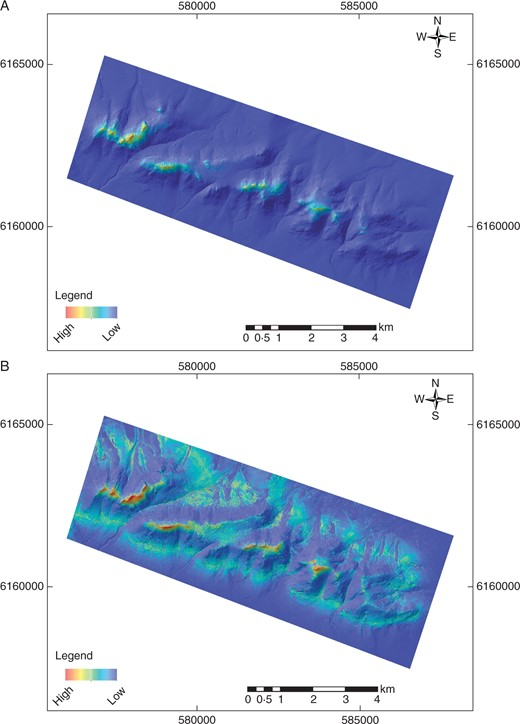
For instance, Keppel et al 2017 developed species distribution models with two endemic flowering plants (Ornduffia calthifolia and O. marchantii) in Austratlia and included a high reolustion lidar-derived DEM. They found that topographic and elevation variables were important for explaining the fine-scale habitat for both species. Using those variables to predict habitat, as shown in the figure above, this study found that areas of suitable habitat for O. marchantii were widespread while r O. calthifolia wasr restricted to higher areas.
Topography grounds ecological analysis in physical reality. It helps explain fine-scale gradients and DEM-derived variables are some of the most widely used predictors in species distribution models, ecosystem mapping, and climate downscaling because they capture stable, process-rich constraints that shape ecosystems over long timescales. In short, topography is the quiet architect of landscapes. DEMs give ecologists the means to map that architecture, and understand the ecological stories it enables.
Topography grounds ecological analysis in physical reality. DEM-derived variables are widely used because they capture relatively stable aspects that shape ecosystems over long time periods. In short, topography is a quiet architect of ecosystems and ecosystems processes.
–
References
Keppel, G., Robinson, T. P., Wardell-Johnson, G. W., Yates, C. J., Van Niel, K. P., Byrne, M., & Schut, A. G. T. (2017). A low-altitude mountain range as an important refugium for two narrow endemics in the Southwest Australian Floristic Region biodiversity hotspot. Annals of Botany., 119(2), 289–300. https://doi.org/10.1093/aob/mcw182