Advent Day 6: Change detection and time series
Dec 6, 2025
Yesterday I wrote about LULC maps, these classified products give ecologists a structured, big-picture view of how land cover and human land use are arranged across the landscape. Today’s focus shifts through time, out to the broader world of multi-temporal remote sensing, which moves beyond snapshots to examine how things are arranged across time.
Change detection and time series analysis both rely on repeated observations, but they answer slightly different questions. Change detection typically asks whether something changed (and ideally when), often linked to discrete events like fires or harvests. Time-series approaches focus on how a pixel or object evolves—capturing gradual greening, drying, or recovery trends that unfold over years. Multi-temporal data can capture transitional changes, like forest succession following harvesting, and conditional changes, like impacts of drought stress on forests.
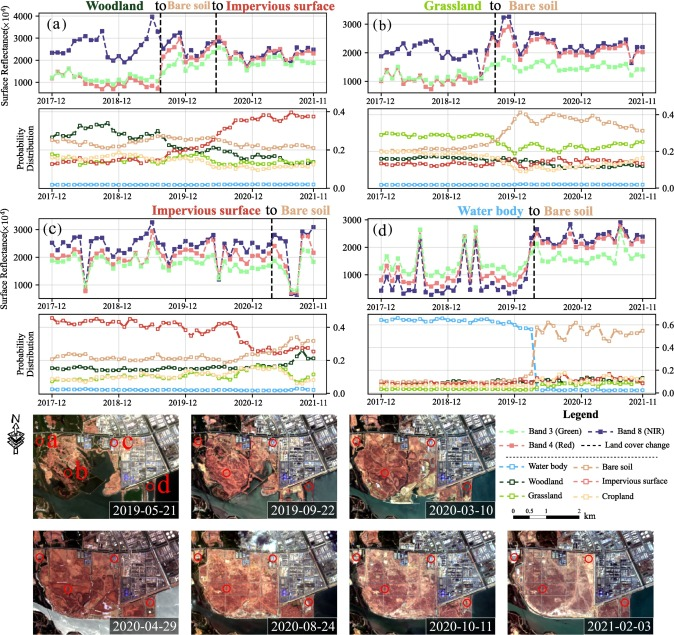
And LULC information can be used too, in fact this is one of the main areas of research! This paper by He et al 2024 introduces a deep-learning model for temporal semantic segmentation change detection that identifies where, when, and what urban land-cover changes occur by learning month-to-month transitions directly from spectral time series.
Remote sensing time series reveal ecological change in ways that single images or two-date comparisons can’t. Raw spectral bands track shifts in greenness, moisture, and surface conditions. Vegetation indices amplify signals of productivity, stress, and disturbance. LULC products translate spectral patterns into interpretable categories that can be compared across years. And repeat lidar point clouds add a structural lens, showing changes in canopy height, biomass, and vertical complexity—whether from disturbance, regrowth, or long-term ecosystem transformation.
A few core methods dominate ecological applications:
- Breakpoint algorithms identify when a disturbance occurred—fire, harvest, insects, drought—sometimes down to the exact month
- Trend analysis captures slow, directional change such as long-term greening, drying, degradation, or recovery
- Harmonic regression and phenology metrics model seasonal “breathing,” flagging shifts in productivity, stress, or timing even when land-cover classes stay constant
- Deep learning and neural network models learn complex temporal patterns, enabling them to detect subtle anomalies, forecast ecosystem trajectories, or integrating multi-sensor time series
- AI-driven change detection frameworks fuse spectral, structural, and contextual cues, to detect small, gradual, or noisy changes that traditional methods might miss
Where single acquisitions provide a static overview, multi-temporal data tell stories. Used together, these tools let ecologists move from spatial patterns to spatiotemporal changes and dynamics, offering deeper insights into how our planet responds to natural and anthropogenic pressures. Multi-temporal remote sensing data open the door to deeper questions about how our world responds to natural dynamics and anthropogenic pressures through time.
If you want to go deeper, Woodcock et al 2020 give a nice accessible review to monitoring with remote sensing.
–
References
He, H., Yan, J., Liang, D., Sun, Z., Li, J., & Wang, L. (2024). Time-series land cover change detection using deep learning-based temporal semantic segmentation. Remote Sensing of Environment, 305. https://doi.org/10.1016/j.rse.2024.114101
Woodcock, C. E., Loveland, T. R., Herold, M., & Bauer, M. E. (2020). Transitioning from change detection to monitoring with remote sensing: A paradigm shift. Remote Sensing of Environment, 238. https://doi.org/10.1016/j.rse.2019.111558