Advent Day 4: Hyperspectral: It's like a rainbow
Dec 4, 2025
Where multispectral imagery captures broad colors like red, green, and near-infrared, and can be used to develop vegetation indices (like NDVI and friends), hyperspectral sensors record reflectance in hundreds of narrow, contiguous bands. Each pixel carries a full spectral signature.
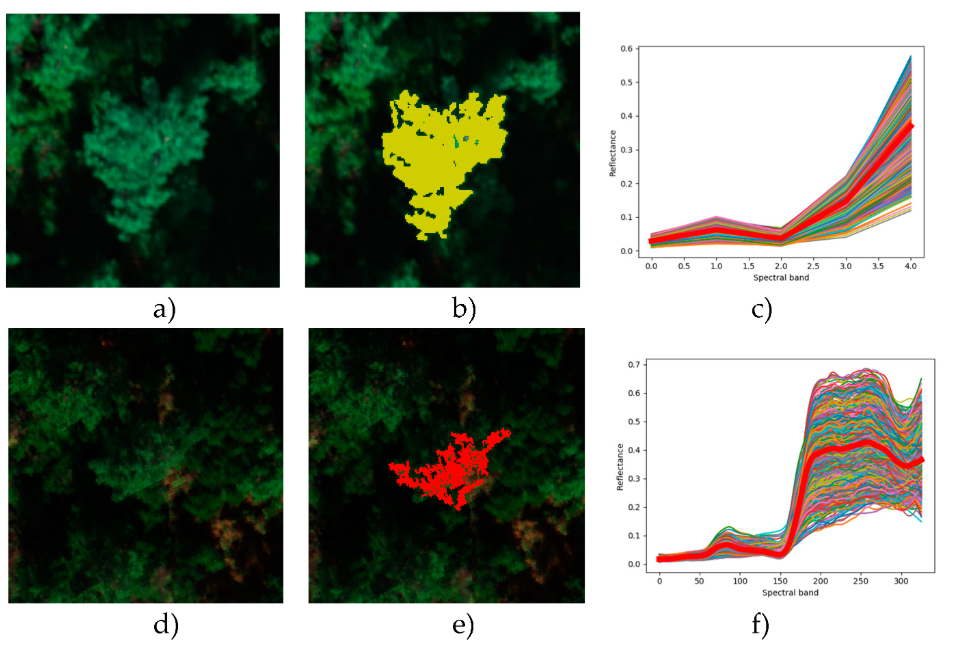
The figure by Iordache et al 2020 illustrates how hyperspectral data reveal details beyond standard RGB imagery. The panels on the left are two RGB views, the center shows delineated tree crowns based on these data, and on the right are the full spectra of all pixels within this crowns. Hyperspectral data produce a continuous reflectance curve across many wavelengths, which is invisible in RGB or multispectral data.
This level of detail lets ecologists go beyond greenness or canopy cover, capturing information that would be difficult or impossible with only multispectral data and indices like NDVI. This richness in detail enables detection of subtle differences in material properties; for instance distinguishing between vegetation types, assessing biochemical traits (pigments, water content, chemical makeup), or even detecting stress, disease, or invasion.
The potential of these data is massive, hyperspectral data can be used for
- Species identification and biodiversity mapping: different species often differ in leaf structure, water content or chemistry. This means that spectral signatures can be distinct, allowing for the classification of vegetation types or species
- Physiological and stress monitoring: subtle shifts in pigment, leaf water content or biochemical composition caused by drought, disease, nutrient deficiency, pollution, or any other kind of stress, can alter spectral reflectance in narrow bands. Often this is detectable with the fine spectral resolution of hyperspectral data at an earlier stage.
- Invasive species detection: hyperspectral data can be used to detect changes in species that may look similar in broad-band multispectral imagery, but differ chemically or structurally
In short, hyperspectral data gives ecologists a more nuanced, chemically and structurally informed view of ecosystems, rather than simply “how green” (multispectral) or “how tall” (lidar). That said, hyperspectral data comes with challenges, notably the large data volumes and complex preprocessing requiring high computing power. But when ecologists need detailed, functional, or species-level insights, hyperspectral data provide an unmatched window into vegetation composition and condition.
References
Iordache, M.-D., Mantas, V., Baltazar, E., Pauly, K., & Lewyckyj, N. (2020). A Machine Learning Approach to Detecting Pine Wilt Disease Using Airborne Spectral Imagery. Remote Sensing (Basel, Switzerland), 12(14), 2280. https://doi.org/10.3390/rs12142280