Advent Day 2: Vegetation indices: NDVI and friends
Dec 2, 2025
If you’ve had any experience with remote sensing, you’ve likely encountered NDVI.
It’s probably the most widely used vegetation index. The normalized difference vegetation index (NDVI)is based on the contrast between red and near infrared reflectance, it is straightforward to calculate, broadly accessible across satellite platforms, and offers an intuitive first look at vegetation condition.
Interpreting NDVI is also relatively simple:
- Higher values typically indicate dense, healthy, green, actively photosynthesizing vegetation
- Moderate values may reflect grasslands, mixed canopies, or partial vegetation cover
- Low values may indicate the occurrence of bare soil, water, snow, or built surfaces
A classic application is tracking seasonal green up and brown down in ecosystems. Here NDVI time series are used to reveal shifts in phenology, for instance, allowing ecologists to compare the timing of spring leaf-out across years or assess how drought alters summer greenness.
However, NDVI has limitations. It saturates in dense forests and is influenced by soil brightness and moisture.
That’s why other indices have been developed. Meet a few of NDVI’s friends:
- EVI (enhanced vegetation index): reduces NDVI’s saturation issues and performs better in dense vegetation
- NDWI (normalized difference water index): relates to canopy water content and is useful for monitoring drought stress or early signs of moisture loss
- NBR (normalized burn ratio): common tool for mapping burned areas and disturbance severity (hence the name!)
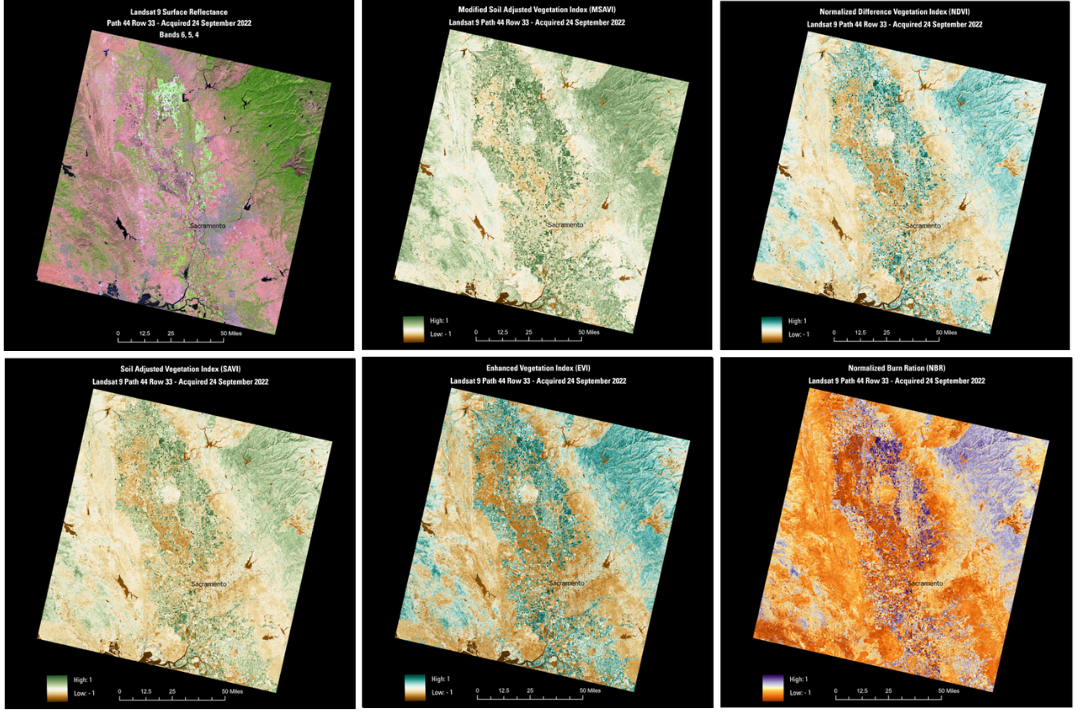
This figure provides an example of some of the many vegetation indices that can be derived from the Landsat satellite missions, which may be useful for examing landscape-level and global terrestrial ecosystem changes.
For ecologists, these indices provide efficient, interpretable indicators of greenness, moisture, stress, disturbance, and more. Vegetation indices offer fast, consistent, accessible insights that can guide further investigation but they are not diagnostic tools on their own. They cannot be used by themselves to distinguish between and attribute different causes of change. For instance, NDVI doesn’t know whether it’s water stress, nutrient limitation, disturbance, or what that is making vegetation more or less green. But NDVI can help identify and quantify changes that are important in ecological systems.
If you want to go deep on this topic, this review by Xue & Su., 2017 and this one by Zeng et al., 2022 (psst, the supplementary material is excellent on this one) are great places to start. There are also a ton of application and environment specific reviews.
References
Xue, J., & Su, B. (2017). Significant Remote Sensing Vegetation Indices: A Review of Developments and Applications. Journal of Sensors, 2017, 1–17. https://doi.org/10.1155/2017/1353691
Zeng, Y., Hao, D., Huete, A., Dechant, B., Berry, J., Chen, J. M., Joiner, J., Frankenberg, C., Bond-Lamberty, B., Ryu, Y., Xiao, J., Asrar, G. R., & Chen, M. (2022). Optical vegetation indices for monitoring terrestrial ecosystems globally. Nature Reviews Earth & Environment, 3(7), 477–493. https://doi.org/10.1038/s43017-022-00298-5